


Town Branch by rheotaxis, part two
By Danny Mayer
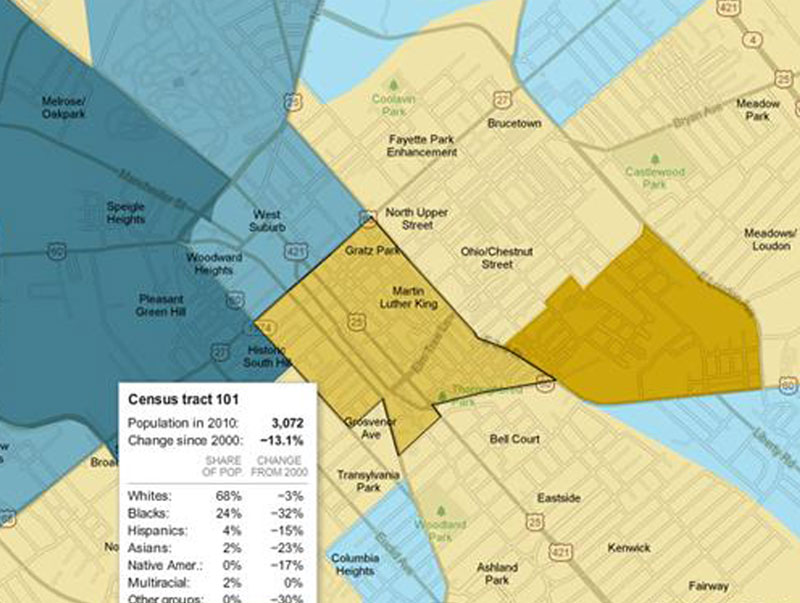
From the NY Time’s “Mapping the 2010 Census.” http://projects.nytimes.com/census/2010/map?hp
The root issue is land.
–Max Rameau
Writing in 1964, the sociologist Ruth Glass created the word “gentrification” to define what she saw at play in many of London’s working class neighborhoods. “One by one,” she noted, they “have been invaded by the middle classes—upper and lower.” What Glass saw should by now be familiar. Old Victorian homes long since broken into multiple blue collar domiciles begin to get restored to single family. Blocks of shabby homes transform into pretty domiciles with fresh paint. New businesses arrive weekly to serve the needs of the newly arrived residents. “Once this process of ‘gentrification’ starts in a district,” Glass observed of these London neighborhoods, “it goes on rapidly until all or most of the original working-class occupiers are displaced and the whole social character of the district is changed.”
In many ways, Glass was writing in 1964 about a topic of marginal interest to an American audience. Though gentrification did occur in select areas of large cities as far back as the 1950s, the general half-century trend that followed World War II here in the non-bombed-out United States was that of suburbanization. The middle class was leaving the city for the unclaimed spaces of newly ripped farmlands, and they were taking their public and private development monies and any other side-capital with them. Along with an aging infrastructure, the working class and poor were what remained behind. Only within the last two decades has this outward trend reversed, with American and global money, its sitcoms, media space, and middle classes now returning to the urban and near-urban core.
One of the first to note this switch was the academic Neil Smith, whose 1996 collection The New Urban Frontier: Gentrification and the revanchist city connects gentrification to the process of eighteenth and nineteenth century frontier land-claiming. For Smith, a geographer by trade whose first-hand observations of the gentrification of New York’s Lower East Side provide the framework for his book, both the present urban frontier and the past “western” frontier are economic and cultural things.
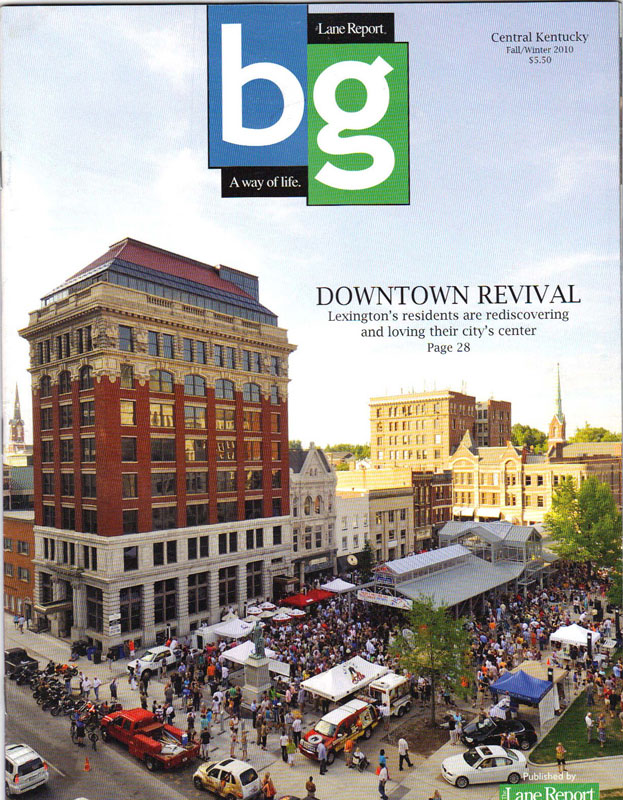
Downtown Revival. Front cover to area publication.
Economically, he argues, the olden frontier “was extended westward less by individual pioneers, homesteaders, rugged individualists, than by banks, railways, the state and other collective sources of capital,” a process mirrored on the urban gentrification frontier, where “banks, real estate developers, small-scale and large-scale lenders, retail corporations, [and] the state” all generally precede or complement most individual urban pioneering.
Culturally, Smith argues that both frontiers help forge a larger “national spirit” expressed as “boosterism.” Where the Indian frontier once allowed men a place to remake themselves anew and a nation to wrap itself in do-gooder mythology, the urban pioneer now utilizes “the [optimistic] language of revitalization, recycling, upgrading and renaissance” that is designed to uplift the spirits (and public coffers) of the pioneer’s home city. “The idea of urban pioneers,” he wrote, “is as insulting applied to contemporary cities as the original idea of pioneers in the US West. Now, as then, it implies that no one lives in the areas being pioneered–no one worthy of notice, at least.”
More recently, Max Rameau, lead organizer of the Miami-based group Take Back the Land, has added a specifically racialized component to the process of gentrification. In the fall of 2006, Rameau’s group seized control of a publicly owned vacant lot and, for six months, constructed what became the Umoja Village Shantytown, a community-based encampment for homeless residents. Like Smith, Rameau recognized the gentrifying work of banks, city and state governments, real estate developers, and the like.
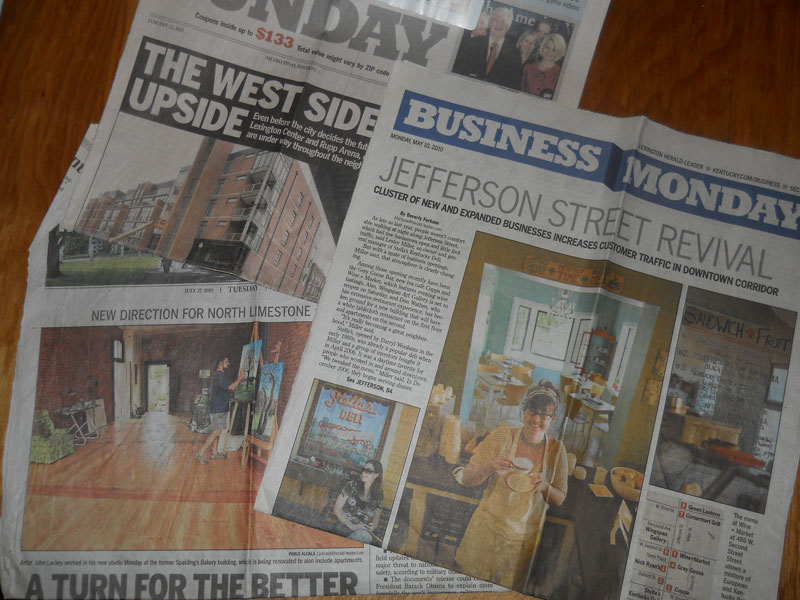
Photo collage by Danny Mayer.
But he placed the thrust of the gentrification process within the strictly racialized narrative of civil rights. “In many ways,” he writes in Take Back the Land: Land, Gentrification & the Umoja Village Shantytown, “gentrification in the 2000s is the functional equivalent of segregation in the 1950s and 60s…In both instances, rich whites make money off of the backs of poor blacks; the government is used to enforce the geopolitical objectives of the larger white community, particularly the wealthier whites who covet the inexpensive and strategically situated black neighborhoods; and black families have little real power to determine, on their own, where they will live. In segregation, we were forced into one area and in gentrification, we are forced out of one area.”
Since 1790, the United States Federal Government has issued a national census of inhabitants living within its territories. Though its numbers make no formal argument for forced and free movement, its data does capture statistical snapshots of stories in motion at all levels of society.
In Lexington, one story that a comparison of the 2000 and 2010 census tells is statistically similar to that of Remeau and Smith. During the first decade of the millennium, the city’s downtown core, census tract 101 running between Maxwell and Third Streets from Thoroughbred Park to Broadway, lost 13.1 percent of its population. While it is true that the Booze District west of Broadway, census tract 102, experienced a 15 percent increase in population, in aggregate the downtown core has still leaked people during its proclaimed boom times. To the core’s immediate north, three census tracts (2, 3 and 4) that span from Newtown Pike to Winchester Road reveal a similar emigration of residents. These booming urban north-side tracts—Jefferson Street (tract 2, 6.9 percent decrease), North Limestone (#3, losing 5.5 percent), and the East End (#4, down 47 percent)—have all lost population. To a lesser extent, the same holds for southern core neighborhoods Chevy Chase (tracts #5 and #6, down 6 percent and 4.6 percent, respectively) and Woodland (tracts 801 and 802), off close to 2.5 percent from its 2000 census population.
The only areas contiguous to the city core showing growth appear in the west end. In the northwest, a largely hispanic influx (and subsequent white flight) around Georgetown Street have transformed tract 11 (11 percent growth) into one of only three majority black tracts. (How many times does one hear city leaders tout this area as symbol of multicultural Lexington success?) At the other end, to the southwest, the undergraduate growth of lily-white UK has stimulated the development of a supra-majority white tract (#9) along the South Broadway corridor.
Sitting between these two west-end growth areas is the tract containing the Distillery District/Town Branch Trail, a demographic mixed bag I’ve taken to calling Booze Branch. This tract, tract 1, experienced 35 percent growth, yet at 1,500 urban people it is still so under-populated that its density (a paltry 900 humans/square mile) more closely resembles horse country (census tract 3701, 109.5 people per square mile) and sparsely covered suburban boom space Jacobson Park (#3913, 1808.7, mostly white) than the 2,500-7,000 people/mile density that stands as the norm throughout most of the living city.
A closer look at the census does locate demographic growth trends—winners and losers, as it were. Downtown, things track Town Branch.
Headwaters: After closure and redevelopment of the Bluegrass Aspendale housing projects in the middle 2000s, nearly half of that tract’s population exited during the decade of urban renaissance that city leaders have openly celebrated several blocks away downtown. The East End also experienced a precipitous 61 percent drop in black population.
Town Branch northern tributaries: 19 percent of the black population left in my MLK neighborhood; 17 percent less blacks now live along the Broadway/Jefferson Street corridor.
Town Branch mainstem: 32 percent of the black population left downtown census tract 101.
What has been visible in Lexington’s celebrated urban renaissance, whitey, my demographic, have thus far achieved demographic victory by attrition. During the previous decade of population decline in both the city core and most contiguous neighborhoods, we emerged 10 percent stronger in MLK; we broke even along Jefferson; and we only experienced a 3 percent net loss—by far the smallest among all demographics—inside the hollowing central downtown core.
Census data taken from New York Times “Mapping the 2010 U.S. Census.”
Part 1: “Connect/April 17, 1779“
Part 3: “Clean/February 2009“
Part 4: “Reveal/September 28, 2011” will be updated soon.
View all four parts together at Town Branch by rheotaxis.
Some essays have been revised in moving from their print to online versions. You can find print versions of this article archived under previous issues. Town Branch by rheotaxis was published June 2013.
Leave a Reply